Global Agriculture Markets 2025: Monthly Commodity Trade Insights
- Feb 6
- 5 min read
The year 2025 brought many developments for global agriculture. Each month had its own story, shaped by crop supplies, consumer demand, government decisions, and global events. Some months presented unique opportunities, while others highlighted trends shaping growth. Using Falconbridge Resources’ 2025 Agriculture Wrap, this guide breaks down the year month by month, showing the most important events and trends—and why they mattered to farmers, traders, and the agriculture industry worldwide.

January: Wheat Sets the Tone for the Year
The year began with wheat at the center of global attention. Worldwide wheat production reached 805 MMT, up 0.6% year-on-year, while demand grew faster at 802 MMT (+1.3%). Despite steady volumes, wheat trade values softened, with exports at USD 55.2 billion, down 6%.
Russia remained the top exporter, increasing shipments by 2%, while Egypt led global imports. The biggest driver of the market was Russia’s export pace and declining stocks, which directly influenced wheat prices across MENA and Africa.
Wheat price direction in early 2025 was largely shaped by Black Sea supply risks, setting a cautious tone for the rest of the year.

February: Maize Brings Stability to Feed Markets
In February, maize supported global feed markets. Global production reached 1,230 MMT (+0.8%), while demand climbed to 1,210 MMT (+1.7%). Maize was traded globally at USD 54.7 billion, supported by rising export and import values.
Brazil emerged as the top exporter with a 4% YoY increase, while China, the top importer, reduced purchases by 3%. Brazil’s record harvest helped stabilize global feed prices during a period of wider commodity uncertainty.
Strong Brazilian supply prevented sharp price increases and supported livestock and feed producers worldwide.

March: Rice Markets Stabilize Under India’s Lead
March highlighted a balanced rice market. Global production reached 535 MMT (+0.9%), closely matching demand at 532 MMT (+1.3%). Global rice trade was valued at USD 29 billion, although trade values declined slightly.
India strengthened its position as the world’s top exporter, growing shipments by 8%, while the Philippines remained the leading importer with 5% growth. India’s strong export performance helped stabilize global rice prices throughout the month.
India’s export performance contributed to a stable global rice market during the month.

April: Sugar Markets Respond to Supply Dynamics
April focused on sugar. Global sugar production reached 185 MMT (+1.1%), but demand slightly exceeded supply at 187 MMT (+1.0%). Sugar trade was valued at USD 28.4 billion, with export values down 2.5%.
India led exports, while Indonesia topped global imports. Production variations in key regions influenced white sugar pricing, creating opportunities for refiners and buyers worldwide.

May: Oilseeds Strengthen Protein Supply
May highlighted oilseeds, a critical input for global protein markets. Production reached 360 MMT (+1.4%), with demand close behind at 358 MMT (+1.7%). Global oilseed trade was valued at USD 62.5 billion.
Argentina remained the top exporter, increasing shipments by 4%, while the EU was the leading importer. Argentina’s strong soy processing volumes continued to anchor the global soymeal market.
Reliable oilseed processing in Argentina helped support protein supply chains worldwide.

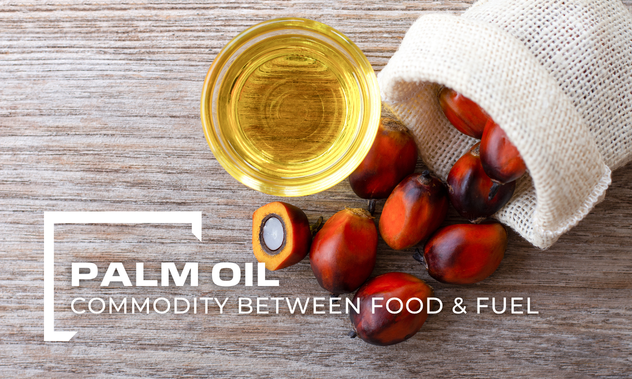
June: Palm Oil Policies Move Global Prices
June brought palm oil into focus. Global production reached 228 MMT (+1.3%), while demand edged higher at 230 MMT (+2.1%). Palm oil trade value climbed to USD 124 billion.
Indonesia dominated exports, growing shipments by 3%, while India remained the top importer. Indonesian supply levels and policies influenced global vegetable oil pricing, providing guidance for market participants.

July: Pulses Ensure Affordable Protein
In July, pulses played a vital role in food security. Global production reached 98 MMT (+1.0%), with demand growing 1.2%. Pulses were traded globally at USD 13.6 billion.
Australia led exports with 3% growth, while India was the top importer. Australian exports helped ensure steady and reasonably priced protein for global buyers.
Strong Australian supply supported affordability in global pulse markets.

August: Fertilizers Support Crop Margins
August highlighted fertilizers, a key input for future harvests. Global fertilizer production reached 200 MMT (+1.0%), with demand at 199 MMT (+1.2%). Trade value stood at USD 71.4 billion.
Morocco was the top exporter, growing shipments by 4%, while Brazil led imports. Morocco’s phosphate industry helped make fertilizers more budget-friendly across global markets.
Steady fertilizer supplies eased cost pressure for farmers worldwide.

September: Cereals Move with the US Harvest
September focused on the wider cereals market. Global production reached 2,911 MMT (+0.4%), while demand grew to 1,210 MMT (+1.3%). Cereal trade was valued at USD 126 billion.
The United States remained the top exporter, while China led imports. US harvest expectations influenced global futures prices and freight movements.
US crop outlooks drove price movements across major cereal markets.

October: Animal Feed Demand Shifts East
October showed strong growth in animal feed markets. Global feed trade reached USD 213 billion, with demand growing 2.1%.
Brazil was the top exporter, while China remained the largest importer. Rising demand from Vietnam reflected Asia’s expanding livestock sector and its growing pull-on global feed grains.
Asia’s livestock growth continued to reshape global feed trade flows.

November: Grain Reserves Reveal Hidden Risks
November turned attention to grain reserves. Global reserves reached 916 MMT, with a 31% stocks-to-use ratio. However, 50% of these stocks were held by China, limiting availability for global markets.
Accessible exportable stocks stood at 460 MMT, highlighting the gap between reported supply and real market access.
High global stocks masked real supply risks for import-dependent regions.

December: Global Agri-Food Ends the Year Under Pressure
December wrapped up the year with a broader agri-food view. In 2025, global agri-food trade reached USD 727 billion, covering 2,911 MMT of products.
Weather patterns, policy developments, and fertilizer availability shaped the year, highlighting opportunities for proactive planning. Looking ahead to 2026, Falconbridge emphasizes the importance of early positioning, diversified sourcing, and monitoring Asia’s growing import demand.

Market Outlook 2026
Looking ahead, Falconbridge Resources’ Market Outlook 2026 points to moderate growth, with opportunities for strategic execution across global agri-food trade.
Global agri-food production is expected to reach 10.9 billion metric tons, growing 0.8% year-on-year, while global demand rises to 2.3 billion metric tons (+1.2%). Total agri-food trade value is projected at USD 1.9 trillion in exports and USD 2.0 trillion in imports, both slightly lower year-on-year, reflecting tighter pricing and cautious buying behavior.
Cereals will remain the largest component of global agri-food trade at 32%, followed by edible oils (22%), sugar (8%), and pulses (5%), with other products making up the remaining share.
Key trends shaping 2026 include:
Logistics planning remains crucial, with shipping routes influenced by weather and other factors.
Early sourcing of fertilizers will help optimize crop margins.
Protein markets, especially pulses and meals, will continue to be closely managed.
Asia’s growing import demand will remain a primary driver of global trade flows.
Commodity-specific guidance for 2026:
Pulses: Import demand of 25–26 MMT, with prices trending up by 3–6%.
Grains: Import demand of 520–530 MMT, with prices broadly flat (±0–2%).
Sugar: Import demand of 65–67 MMT, with prices trending down 5–8%.
Fertilizers: Demand growth of 2–3%, with prices expected to decline 5–10%.
The overall strategic guidance for 2026 is clear: secure positions early, diversify corridor exposure, and closely monitor Asia-driven demand shifts.
Final Takeaway
The 2025 agriculture landscape showcased the importance of access, timing, and strategic planning. While production and global stocks remained strong, real-world factors such as policy changes, climate, and logistics influenced pricing and availability. Success in 2026 will be guided by early contracting, diversified sourcing, flexible trade corridors, and monitoring Asia’s rising demand. Falconbridge Resources continues to turn market insights into practical, strategic trade solutions.